



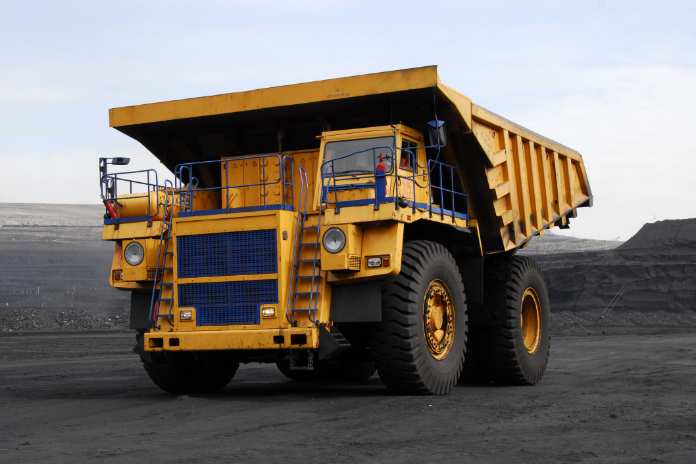
- 9M cash cost of $2,059/oz – below the lower end of guidance
- 9M AISC of $2,310/oz – below the lower end of guidance
- 2026 production guidance the raised for the second time to 235,000 -245,000 oz
MEDELLIN, Colombia, Nov. 11, 2026 (GLOBE NEWSWIRE) — Mineros S.A. (TSX:MSA, OTCQX:MNSAF, BVC:MINEROS) (“Mineros” or the “Company”) today reported its financial and operating results for the three and nine months ended September 30, 2026. All dollar amounts – other than per share amounts – are expressed in thousands of US dollars unless otherwise stated. For further information, please see the Company’s unaudited condensed interim consolidated financial statements and management’s discussion and analysis posted on Mineros’ website https://mineros.com.co/en/investors/financial-reports and filed under its profile on www.sedarplus.com.
Financial Highlights for the three and nine months ended September 30, 2026
- Revenue of $279,217 in the third quarter of 2026 (“Q3 2026”) was driven by strong operational performance across both operating properties and a robust gold price environment. These factors contributed to record revenue in the first nine months of 2026 of $838,006 — the strongest revenues for any nine-month period in the Company's history.
- Adjusted EBITDA surged 65% year-over-year to $401,995, for the first nine months of 2026, driven by higher gold and silver prices and ounces, alongside a stable fixed cost structure.
- The Company delivered a record net profit in the first nine months of $222,285 ($0.76 per share), with Q3 2026 net profit of $89,467 ($0.30 per share) demonstrating the consistent earnings power of the business across both Colombia and Nicaragua.
- As at September 30, 2026, cash and cash equivalents, and total precious metals added to $278,555, comprising cash and cash equivalents of $54,032, and total precious metals inventory of $224,523 (equivalent to 50,533 ounces of gold and 227,038 ounces of silver), reflecting the Company's investment management policy of allocating some of the Company’s treasury to gold holdings. Gold-backed receivables totalled $71,301 (equivalent to 16,391 ounces of gold and 26,379 ounces of silver).
- As at September 30, 2026, the Company held 22,369 ounces of gold in ore stockpiles and under processing and 1,586 of concentrate gold (valued at a cost of $2,189 per oz) for a total value of $52,456. This corresponds to (i) an increase of 16,692 ounces compared with the amount held at December 2025, as the Company accumulates ore feed as part of the development of the Hemco processing plant capacity expansion from 1,750 to 2,500 tonnes per day. The expansion work is expected to be completed by year-end 2026, followed by a minor ramp up to achieve renewed nominal capacity and (ii) 1,586 ounces of concentrate gold held at the Nechí Property representing finished inventory produced but not sold prior to quarter-end.
- As at September 30, 2026, loans and borrowings were $127,735, compared with $15,398 at December 31,2025.
Operational Highlights for the three and nine months ended September 30, 2026
- Gold production totaled 62,253 ounces in Q3 2026, up 13% compared with Q3 2025. Hemco produced 37,698 ounces, up 18%, driven primarily by higher feed grades due to more ore purchased from Bonanza Mining Partners (“BMP”) at higher average grades. Throughput at Hemco was similar in each period notwithstanding the increased capacity at the processing plant because we had 15 days of downtime and additional days when production was scaled back as new components were introduced to the processing plant. Nechí produced 24,555 ounces, up 8%. Consolidated gold production for the first nine months of 2026 totaled 180,3561 ounces, up 11% compared with the same period of 2025.
- Gold sold of 61,283 ounces (64,499 AuEq) in Q3 2026, a 12% increase over Q3 2025, contributed to a total of 178,772 ounces in the first nine months of 2026 (187,133 AuEq) a 10% increase, period over period, prompting the Company to revise upward, for a second time, its full-year 2026 guidance to 235,000 – 245,000 ounces from 220,000 – 240,000, and originally 213,000 – 233,000. The difference between gold produced and gold sold in the quarter is mainly comprised of concentrates inventory at the Nechí Property pending shipment at quarter-end.
- Silver sold of 211,308 ounces in Q3 2026, more than double the 100,159 ounces sold in Q3 2025, reflecting the success of the metallurgical optimization program at the Hemco processing plant. For the first nine months of 2026, 523,754 ounces of silver were sold, an 111% increase over the same period in 2025.
- Costs tracked below forecast for the first nine months of 2026: Cash Cost per ounce of gold sold of $2,059 came in below full-year guidance of $2,070 – $2,170/oz. Likewise consolidated AISC was $2,310/oz, below the guided range of $2,370 – $2,470/oz. In Q3 2026 Cash Cost of $1,974 per ounce of gold and AISC of $2,238 per ounce of gold reflect continued cost discipline, and a lower gold price, which made the cost of purchasing ore from BMP and CMP lower than budgeted.
- During the third quarter of 2026, the Nechí Property commenced the sale of gold in concentrates format to third-party traders, marking a strategic shift in the commercialization model for this operation. This transition reflects the advancement of the drying, sampling, and packaging facility commissioned during the period, and is expected to support increased production flexibility and commercial optionality for the segment going forward.
Strategic Highlights for the three and nine months ended September 30, 2026
- Mineros was added to the MVIS Global Junior Gold Miners Index, the underlying index of the VanEck Junior Gold Miners ETF, the Solactive Junior Gold Miners Custom Factors Index, the underlying index of the Sprott Junior Gold Miners ETF, and to the Small Cap segment of the FTSE Global Equity Index Series pursuant to each of their semi-annual reviews. Additionally, the creation of the TEVA Colombia Equity Index, the underlying benchmark for TEVAICOL, the first locally managed Colombian equity ETF, recently launched on the Colombian Stock Exchange on September 10, 2026, provided additional demand for Mineros common shares through its addition to TEVAICOL ETF.
- Advanced the Hemco plant expansion in Nicaragua, with sustained throughput reaching 2,300 tonnes per day (“tpd”) by September, a 31% increase over the 1,750 tpd baseline. The expansion work is expected to be completed by year-end 2026, followed by a minor ramp up to achieve renewed nominal capacity.
- Mineros revised its consolidated gold production guidance for 2026 again to 235,000 – 245,000 ounces (from 220,000 – 240,000 which had also been revised upward from 213,000 – 233,000 ounces). This guidance flows from confidence in the Company’s ability to increase production by prioritizing capital investment and improving the operations. The Hemco Property (Nicaragua) is expected to contribute 148,000 – 152,000 oz, while the Nechí Property (Colombia) will produce 87,000 – 93,000 ounces of gold.
- Preparing first NI 43-101 compliant Mineral Resources Estimate for recently acquired gold exploration project in Tolima, Colombia by Q1 2027. The Company plans to continue surface exploration within the Tolima Project area in accordance with the Programa Único de Exploración y Explotación (PUEE). Planned activities include geological mapping, rock sampling and soil sampling to further assess the Tolima Project’s exploration potential. In parallel, the Company intends to advance an internal prefeasibility study, and progress environmental studies to support the Tolima Project’s evaluation and potential development.
- Porvenir Project entered detailed engineering phase following an independent engineering review of the updated prefeasibility study published March 31, 2026 (the “2026 PFS”). A construction decision is expected in early 2027. To ensure effective capital allocation and project execution, Mineros engaged a consortium of globally recognized engineering firms to conduct a comprehensive gap analysis of the Porvenir Project’s technical parameters. The review confirmed the Project’s readiness, and detailed engineering has already commenced on the main components of the Project. Additionally, the Company completed 4,795 metres across 25 holes at the Porvenir Project. Infill drilling accounted for 4,008 metres across 20 holes, bringing the infill program to 87% completion against the annual plan. Infill drilling targeted Porvenir Sur, Real McCoy, and Porvenir Norte, aimed at reducing geological uncertainty and de-risking the first three years of the mine plan. Condemnation drilling totaled 786 metres across 5 holes, advancing that program to 42.7% completion.
- Repurchased 1,320,622 common shares for $6.5 million during Q3 2026, bringing the total number of shares repurchased in the first nine months ended September 30, 2026 to 5,404,119 shares for an aggregate value of $24.5 million. The total size of the Company’s share repurchase program is $175 million, which was approved on July 14, 2026 and is in effect until March 27, 2029.
- In exploration during the third quarter the Company drilled 10,169 metres of near-mine exploration drilling, 2,760 metres at Panama and 7,409 metres at Pioneer in Nicaragua, the two underground operating mines at the Hemco Property. For the first nine months of 2026, 22,305 metres were drilled. During the third quarter of 2026, the Company completed 4,737 metres of drilling at Xiloa and Xolotlan focused on brownfield exploration. Exploration drilling for the nine months ended September 30, 2026 totalled 12,254 metres. This campaign forms part of the Company's ongoing focus on resource replacement at both the Panama and Pioneer mines. In addition, 165 holes of sonic and ward drilling were completed at the Nechí Property during the third quarter of 2026, representing 5,005 metres. The program comprised 4,926 metres of infill drilling in current production areas and 79 metres of reconnaissance drilling at the Río Cauca Target. Of the total, 4,941 metres in 162 holes were completed using sonic drilling and 64 metres in three holes using ward drilling.
- La Pepa exploration drilling campaign was deferred due to severe weather and heavy winter snow accumulation, which restricted access to the high-altitude site. The first drill rig is scheduled to begin operating during the first week of December 2026, followed by a second rig during the first week of January 2027. At a target drilling rate of 600 metres per rig per month, the Company expects to complete approximately 600 metres by December 31, 2026. The balance of the campaign is planned to continue through late June 2027, subject to seasonal operating conditions and safety requirements.
- Mineros is the principal contributor and project manager of a new public secondary school in El Bagre, Antioquia, within the Nechí Property operating footprint. Total project investment is estimated to be approximately COP $38.7 billion (≈ US$12.1 million), co-funded with EPM, Grupo Argos, and Grupo Nutresa. This initiative was financed through Colombia’s Obras por Impuestos (“Works-for-Taxes”) mechanism, which redirects corporate income tax into community infrastructure in post-conflict municipalities. The new 11,000 m² campus will serve more than 1,080 students in a region historically affected by armed conflict and illegal mining.
Daniel Henao, President and Chief Executive Officer of Mineros, commented: “Q3 2026 demonstrates the earnings leverage embedded in our growing production profile. With costs tracking below the low end of guidance and Hemco Property’s production guidance revised upward for the second time in the year, we generated revenue of $838 million and net profit of $222 million; the strongest first nine months of any year in the Company's history. The Hemco expansion is advancing on schedule, gold and silver recoveries are improving, and the Porvenir prefeasibility study is delivering compelling economics. We are executing with discipline and are well positioned for the next phase of Mineros' growth.”
“We also took deliberate steps this quarter to strengthen our balance sheet through an allocation to physical gold and gold-linked receivables, ending the period with gold-backed assets equivalent to 66,924 ounces of gold. This position reflects our view that gold remains an effective long-term store of value in the current macroeconomic environment. We regard it as a natural extension of our capital management framework, one that reinforces our identity as a gold producer and aligns our treasury with the interests of shareholders who invest in Mineros for exposure to the gold sector.”
Dividends declared
On March 27, 2026, Mineros held the Ordinary Meeting of the General Shareholders’ Assembly (“the Assembly”). During the session, the Assembly approved the distribution of the Company’s profits in the form of a dividend. Shareholders are entitled to receive payment of an annual ordinary dividend of US$0.10 per common share they hold, payable in four equal quarterly installments of US$0.025, which is equivalent to a total distribution of US$29,578,052, payable quarterly on April 27, July 21, October 19, 2026, and January 18, 2027.
The record and payment dates for the next dividends payments are set out below:
| Record Date | Payment Date | Amount per Share ($) | Amount per Share (COP$)(1) | |
| Ordinary Dividend | January 8, 2027 | January 18, 2027 | 0.025 | 102.51 |
(1) U.S. dollar amounts converted to Colombian pesos for informational purposes, based on the average monthly Representative Market Rate (Tasa Representativa del Mercado – TRM) published by the Colombian Superintendence of Finance for the year ended December 31, 2025, of $1.00 = approximately COP$4,100.54.
Payment of each dividend amount will be made on each payment date in U.S. dollars, which may in some cases be converted into local currency at the foreign exchange rate on the date of payment.
The approved dividend is consistent with the Company’s dividend policy, which provides for the distribution of at least 15% of the net income of the prior fiscal year, provided that doing so is consistent, in management’s good-faith judgment, with maximizing the long-term value of the Company.
Subsequent events
Repurchase agreement transaction for working capital purposes
Mineros Switzerland AG, a wholly-owned subsidiary of the Company, entered into two physically settled gold posted and repurchase transactions. On October 16, 2026, it posted 20,000 ounces of gold for net proceeds of US$73,224 (after posting an upfront independent amount of US$8,696 as collateral) with an obligation to repurchase the gold on October 19, 2027. On October 29, 2026, it posted 8,981 ounces of gold for net proceeds of US$32,000, with an obligation to repurchase the gold on February 2, 2027.The obligations of Mineros Switzerland AG under these transactions are guaranteed by Mineros S.A. Because the Company retains the economic exposure to the price of gold, the transactions will be accounted for as financial liabilities. The transactions require additional cash margin to be posted if the gold price declines. The net proceeds are being used for general corporate purposes.
Proposed Special Dividend of Approximately US$58 Million
As announced on October 23, 2026, shareholders will be asked, at a special meeting of shareholders scheduled for November 24, 2026 (the “Meeting”), to approve the release of a portion of the Company’s occasional reserves, constituted out of profits of fiscal years ended on or before December 31, 2025, and the distribution of the released amount as a one-time special cash dividend of US$0.20 per common share, representing approximately US$58 million in aggregate (the “Special Dividend”).Subject to approval by the General Shareholders’ Assembly, the special dividend would be payable on December 4, 2026 to shareholders of record on December 1, 2026, in addition to the previously approved ordinary dividend, and is expected to be funded from cash on hand and cash flows from operations. Further information is set out in the Company’s management information circular dated October 15, 2026.
The following table summarizes the financial highlights for the three and nine months ended September 30, 2026 and 2025.
| Three Months Ended On September 30, | Variation | Nine Months Ended September 30, | Variation | |||||||||||||
| 2026 | 2025 | $ | % | 2026 | 2025 | $ | % | |||||||||
| Revenue | 279,217 | 195,978 | 83,240 | 42 | % | 838,006 | 538,941 | 299,065 | 55 | % | ||||||
| Cost of sales | (145,082 | ) | (114,320 | ) | (30,762 | ) | 27 | % | (464,045 | ) | (318,164 | ) | 145,881 | 46 | % | |
| Gross Profit | 134,136 | 81,658 | 52,478 | 64 | % | 373,961 | 220,777 | 153,184 | 69 | % | ||||||
| Net Profit for the period | 89,467 | 54,063 | 35,404 | 65 | % | 222,285 | 135,571 | 86,714 | 64 | % | ||||||
| Basic and diluted earnings per share ($) | 0.30 | 0.18 | 0.12 | 68 | % | 0.76 | 0.45 | 0.30 | 67 | % | ||||||
| Average realized price per ounce of gold sold ($)1 | 4,301 | 3,464 | 837 | 24 | % | 4,451 | 3,220 | 1,231 | 38 | % | ||||||
| Cash Cost per ounce of gold sold ($)1 | 1,974 | 1,704 | 270 | 16 | % | 2,059 | 1,604 | 455 | 28 | % | ||||||
| AISC per ounce of gold sold ($)1 | 2,238 | 1,982 | 256 | 13 | % | 2,310 | 1,869 | 441 | 24 | % | ||||||
| Adjusted EBITDA1 | 140,022 | 90,276 | 49,746 | 55 | % | 401,995 | 243,854 | 158,141 | 65 | % | ||||||
| Operating cash flow before strategic gold purchases | 115,663 | 77,316 | 38,347 | 50 | % | 194,913 | 148,770 | 46,143 | 31 | % | ||||||
| Net cash flows (used in) provided by operating activities | (21,638 | ) | 77,316 | (98,954 | ) | (128 | %) | (52,396 | ) | 148,770 | (201,166 | ) | (135 | %) | ||
| Net free cash flow1 | 101,063 | 62,400 | 38,663 | 62 | % | 154,107 | 106,441 | 47,666 | 45 | % | ||||||
| ROCE1 | 66 | % | 47 | % | 19 | % | 39 | % | 66 | % | 47 | % | 19 | % | 39 | % |
| Net Cash1 | 71,678 | 84,582 | (12,904 | ) | (15 | %) | 71,678 | 84,582 | (12,904 | ) | (15 | %) | ||||
| Dividends paid | 7,262 | 7,461 | (199 | ) | (3 | )% | 22,007 | 22,410 | (403 | ) | (2 | %) | ||||
- Average realized price per ounce of gold sold, Cash Cost per ounce of gold sold, AISC per ounce of gold sold, Adjusted EBITDA, net free cash flow and Net Cash are non-IFRS financial measures, and ROCE is a non-IFRS ratio, with no standardized meaning under IFRS, and therefore may not be comparable to similar measures presented by other issuers. For further information and detailed reconciliations to the most directly comparable IFRS measures, see Section 10 – Non-IFRS and Other Financial Measures in the Company´s MD&A.
Financial Summary for the three months ended September 30, 2026
- Revenue increased by 42% to $279,217 during the third quarter of 2026, compared with $195,978 in the third quarter of 2025. This growth was primarily driven by a 24% increase in the average realized gold price, a 12% rise in ounces of gold sold and an increase in silver sales of 230%, or $9,706. Gold sales in the third quarter of 2026 totaled $263,595 at an average realized price of $4,301 per ounce, up from $190,051 at an average realized price of $3,464 per ounce in the third quarter of 2025.
- Cost of sales increased by 27% to $145,082 during the third quarter of 2026, compared with $114,320 in the corresponding period of 2025. This increase of $30,762 was predominantly attributable to variable costs, which are directly correlated with gold price trends and gold sales volumes, rising by 24% and 12%, respectively. Consequently, BMP's costs increased by $17,366, driven by gold purchases totaling 5,779 ounces. Taxes and royalties increased by $5,655, and gold purchases from CMP's rose by $3,686, representing 624 ounces. With respect to the Nechí Property's unit costs, these increased by 21%, principally as a result of the 25% devaluation of the United States dollar, which had an impact of approximately $287 per oz. Excluding the aforementioned currency effect, unit costs increased by only 0.1%, equivalent to $2 per oz, relative to the same period in 2025. With regard to the Hemco Property's unit costs, a reduction of 0.8% was recorded in comparison to the same period in 2025, further supported by arising from higher inventory levels.
- Gross Profit increased by 64% to $134,136 in the third quarter of 2026, compared with $81,658 in the same period of 2025. The increase was mainly driven by higher gold prices, combined with an increase in ounces of gold sold compared with the same period in the prior year.
- Profit for the period increased by 65% to $89,467 or $0.30 per share during the third quarter of 2026, compared with $54,063 or $0.18 per share during the third quarter of 2025.
- Adjusted EBITDA was $140,022 during the third quarter of 2026, up 55% from $90,276 in the third quarter of 2025. The increase was due to stronger gold and silver prices (24% and 57% respectively), alongside continued cost discipline across the Company’s operations.
- Operating cash flow before strategic gold purchases increased by 50% to $115,663 in the third quarter of 2026, compared with $77,316 in the third quarter of 2025 due to increased cash received from sales of goods of $103,625 which was partially offset by a higher payments to BMP & CMP of $28,328, higher payments of good and services by $17,408, an increase in payments of futures contracts of $5,000 and higher payments of employees social security, premiums and claims of $4,416 and $3,819 respectively.
- Net cash flow generated by operating activities was $(21,638), down 128% in the third quarter of 2026, compared with $77,316 in the same period of 2025. The decrease was primarily due to the purchases of gold bullion of $137,301 as part of the Company’s strategy of maintaining exposure to bullion as part of its investment management policy.
- Net free cash flow for the three months ended September 30, 2026, was positive at $101,063, compared with $62,400 in the same period of 2025. The increase is attributable to lower net cash flow generated by operating activities more than offset by strategic gold purchases.
- Dividends Paid during the third quarter of 2026 were $7,262, consistent with the amount distributed in the same quarter of 2025.
Financial Summary for the nine months ended September 30, 2026
- Revenue increased by 55% and totaled $838,006 during the nine months ended September 30, 2026, compared with $538,941 in the nine months ended September 30, 2025. The increase in revenue is due to a 38% increase in the average realized price of gold sold, a 10% increase in ounces of gold sold and an increase in silver sales of 306%. Gold sales totaled $795,784 at an average realized price per ounce of gold sold of $4,451 in the nine months ended September 30, 2026, compared with sales of gold of $524,896 at an average realized price per ounce of gold sold of $3,220 in the nine months ended September 30, 2025.
- For the nine months ended September 30, 2026, cost of sales rose 46% to $464,045, up from $318,164 in the corresponding period of 2025. The $145,881 increase was driven primarily by variable costs — which move in tandem with gold price trends and gold sales volumes — climbing 38% and 10%, respectively. BMP's costs accounted for $86,209 of this growth, reflecting gold purchases of 17,751 ounces, while taxes and royalties contributed an additional $24,786. CMP's gold purchases also increased by $9,313, representing 1,459 ounces. At the Nechí Property, unit costs rose 25%, largely owing to an 18% depreciation of the United States dollar, which carried an estimated impact of approximately $209 per oz; absent this currency headwind, the underlying unit cost increase was 9.2%, or $120 per oz, relative to the same period in 2025, due to higher payroll and services expenses. The Hemco Property, by contrast, achieved a unit cost increase of 7.1% or $178 per oz year-over-year, mainly due to higher depreciation and amortization, however the total cost decreased by $5,930 due to the transfer from cost to inventory.
- Gross Profit increased by 69% to $373,961 in the nine months ended September 30, 2026, compared with $220,777 in the nine months ended September 30, 2025; due to a 55% increase in revenue, due to higher gold prices, which was partially offset by a 46% increase in cost of sales as explained above.
- Profit for the period was up by 64% to $222,285 or $0.76 per share during the nine months ended September 30, 2026, compared with $135,571 or $0.45 per share during the nine months ended September 30, 2025. The increase in profit is due to the increase in gross profit, partially offset by: higher current tax expenses of $57,100 as a result of the higher profit before taxes; and an unrealized loss of $10,507 on the forward contract entered into as part of the Company's strategic gold position (see "Strategic Gold Position" in Section 2).
- Adjusted EBITDA was up 65% to $401,995 during the nine months ended September 30, 2026, compared with $243,854 during the nine months ended September 30, 2025, due to a 55% increase in revenue, offset by a 46% increase in cost of sales, and an increase of $1,872 in administrative expenses.
- ROCE was 66% as at September 30, 2026, compared with 47% as at September 30, 2025. The increase is mainly attributable to 72% higher Adjusted EBITDA over the last 12 months, resulting from higher gold prices and production (an additional 15,759 ounces). Capital employed increased by 31%, reflecting higher capital expenditures on property, plant and equipment, the acquisition of 80% of the La Pepa Project not previously owned, and the accumulation of gold-backed assets under the Company's strategic gold position, which contributed to the increase in trade accounts receivable and inventories (see "Strategic Gold Position").
- Net cash was $71,678 as at September 30, 2026, compared with $84,582 as at September 30, 2025, reflecting precious metals holdings – excluding bullion under gold repurchase agreements – of $145,381, cash and cash equivalents of $54,032 partially offset by 624% higher loans and other borrowings of $127,735. Holdings of precious metals in the Company’s treasury is an asset that effectively reduces the Company's net indebtedness to the same extent as cash. The balance sheet remains conservatively structured, providing financial flexibility to support ongoing investments and future growth initiatives.
- Dividends Paid were down 2% to $22,007 during the nine months ended September 30, 2026, compared with $22,410 in the same period of 2025. The decrease is because there were fewer issued and outstanding shares on average in the first nine months of 2026 than in the first nine months of 2025.
- Operating cash flow before strategic gold purchases increased by 31% to $194,913 as at September 30, 2026, compared with $148,770 in the same period of 2025 due to a significant increase of cash received from sales of goods of $273,360, offset by higher payments to BMP and CMP of $107,065, higher payment of goods and services of $37,816, higher payments of income tax of $40,889, a margin deposit of $15,000 corresponding to a guarantee provided in connection with an over the counter (OTC) forward and higher other outflows of cash of $20,246.
- Net cash flow used by operating activities was $52,396 compared with net cash flow provided by operating activities of $148,770 in the same period of 2025. The decrease was due to higher purchases of gold bullion of $247,309 as part of the Company’s strategy of maintaining exposure to bullion as part of the Company’s investment management policy.
- The Company's net free cash flow for the nine months ended September 30, 2026, totaled $154,107, up from $106,441 in the same period of 2025. This increase reflects strong operational performance driven by higher gold and silver prices and increased ounces sold. Additionally, the variance was impacted by working capital movements associated with the Company's strategic gold position (see "Strategic Gold Position).
- Capital investments and expenditures for the first nine months ended September 30, 2026, capital investments and expenditures were $58,165, which totalled 51% of the annual capital expenditures budget of $113,681 and were composed of $$43,057 for additions to property, expansion of processing plant and equipment and intangibles, $9,328 for leases, $5,780 for exploration. Growth capital is heavily weighted toward the last quarter of the year. While total capital expenditures are forecast to be close to the total budget, current projections for sustaining capital will be approximately 85% of original projections, with growth capital projected to be 106% of original and exploration spend will be closer to $14,100. We remain focused on driving production growth through organic capacity expansion, anchored by scaling the Hemco processing plant to 2,500 tpd, and supported by an exploration program designed to bolster near-term production while advancing a pipeline of opportunities across the portfolio.
2026 Guidance
For 2026, Mineros is providing a revised consolidated gold production guidance of 235,000 to 245,000 ounces of gold. This guidance flows from a disciplined focus on "quick-return" ounces, prioritizing capital investment toward brownfield projects and operational efficiencies that can be brought online rapidly to maximize free cash flow in a robust commodity market.
2026 Operational & Cost Outlook
The Company’s production and cost guidance reflects a commitment to maintaining healthy margins despite global inflationary pressures.
| Production and Cost Guidance | units | 2026 |
| Nechí Property (Colombia) | oz | 87,000 – 93,000 |
| AISC per ounce of gold sold (Own operation) | $/oz | $1,820 – $1,920 |
| AISC per ounce of gold sold (CMP) | $oz | $3,800 – $ 3,900 |
| AISC per ounce Total Nechi Property | $oz | $2,090 -$2,190 |
| AISC Margin (Contract Mining Partners)1 | % | 11 – 14 |
| Hemco Property (Nicaragua) | 148,000 – 152,000 | |
| AISC per ounce of gold sold (Underground operation ) | $/oz | $2,000 – $2,100 |
| AISC per ounce of gold sold Total Hemco property | $oz | $2,465 – $2,565 |
| AISC Margin (BMP)1 | % | 39 – 41 |
| Consolidated | ||
| Gold production | oz | 235,000 – 245,000 |
| Cash Cost per ounce of gold sold1 | $/oz | $2,070 – $2,170 |
| AISC per ounce of gold sold1 | $/oz | $2,370 – $2,470 |
Note to Guidance: The following assumptions were used: a gold price of $4,405; inflation rates of 5% in Colombia and 3% in Nicaragua; a COP/USD exchange rate of $3,850; and average salary increases of 17% in Colombia and 5% in Nicaragua. While our 2026 guidance is anchored in our primary gold reserves, the Company continues to optimize silver recovery at the Hemco Property processing plant. Although silver grades and quantities are not currently classified in either of the Company’s Mineral Reserves or Mineral Resources, we expect improvements to our ability to recover silver will provide a positive impact on our revenues and consolidated AISC. For reporting purposes, any silver recovered will be disclosed as AuEq production using the then-average price per ounce sold of each metal.
1. These measures are forward-looking non-IFRS financial measures. For further information concerning the equivalent historical non-IFRS financial measures, see Section 10 – Non-IFRS and Other Financial Measures in the Company´s MD&A.
In 2026, the Hemco Property (Nicaragua) is expected to deliver solid performance with gold production guidance of 148,000 – 152,000 ounces. The Panama & Pioneer operations are expected to have an AISC range of $2,000 – $2,100 per ounce. In addition, the BMP arrangement is expected to generate a 39% – 41% AISC margin, providing a robust contribution to production.
For the Nechí Property (Colombia), Mineros is targeting steady gold output of 87,000 – 93,000 ounces in 2026. Company-owned dredges are expected to operate within an AISC range of $1,820 – $1,920 per ounce, underpinned by continued focus on optimizing operations and controlling costs. The CMP are expected to deliver an AISC margin of 11% – 14%, representing consistent and dependable cash generation at this operation.
Capital Expenditures (“CAPEX”): Financing the Growth Horizon
The 2026 CAPEX budget is structured to balance sustaining requirements with high-impact growth initiatives.
| Category | Investment (US$) | Strategic Objective |
| Growth CAPEX | $51.7 Million | Hemco plant expansion, Porvenir (Nicaragua) and La Pepa (Chile) technical studies |
| Sustaining CAPEX | $44.7 Million | Operational continuity and infrastructure renewal |
| Exploration | $17.3 Million | Resource-to-Reserve conversion Greenfield exploration |
| Total CAPEX | $113.7 Million | |
Nicaragua Expansion and Long-Term Scalability
Approximately 78% of the Company’s growth capital is allocated to Nicaragua, including a $23 million project to expand processing capacity at the Hemco Property from 1,750 to 2,500 tonnes per day. Expansion work remains ongoing as part of the Company’s phased approach to organic production growth. Hemco’s Q3 2026 production growth was driven primarily by higher feed grades and the contribution of ore purchased from Bonanza Mining Partners (“BMP”).
As part of its longer-term expansion planning, Mineros is evaluating the installation of a 1,000-tonne-per-day mill already owned by the Company. The evaluation is focused on addressing processing bottlenecks and supporting potential future production growth in Nicaragua.
Beyond these immediate gains, Mineros is evaluating the strategic installation of a 1,000 tpd mill already in the Company’s asset inventory. This project is viewed as a critical de-bottlenecking exercise intended to increase output in Nicaragua. By addressing processing throughput limitations, the Company is laying the groundwork for a transition to significantly higher production capacity over the longer term.
The Company is also focused on advancing the Porvenir Project through the final stages of permitting and engineering studies. In April 2026 Mineros received the Environmental Certification from the Attorney General's Office for the processing plant and tailings storage facility, marking one of the final milestones towards full project permitting. The Company has submitted the regulatory information for sectorial forest management authorizations to the competent institutions. These pending permits will be obtained in accordance with national regulations, and are expected by the end of Q4 2026. The pre-feasibility study for the Porvenir Project (“2026 PFS Update”) demonstrates that the Mineral Reserves are economically viable at the consensus forecast prices of $3,150/oz Au, $45.00/oz Ag, $4.72/lb Cu, and $1.22/lb Zn over the life-of-mine (“LOM”). The 2026 PFS Update base case economics result in an after-tax net present value at a 5% discount rate of approximately $460 million, an after-tax IRR of 37.9%, and a payback period of approximately 2.0 years from the start of production.
Initial capital costs are estimated at $206.8 million, including contingency. LOM sustaining capital is estimated at $66.2 million, and closure and reclamation costs are estimated at $33.4 million. The Porvenir project already holds the environmental permit for mining operation, significantly de-risking the path to production.
The company will continue evaluating technical and economic figures as detailed engineering advances towards decision of construction.
Colombia: Nechí Property Optimization, Growth and Formalization.
In 2026, the Nechí Property program combines recovery improvements in the existing dredge fleet, sustaining investments and the first stage of a new growth platform. Average gold recovery rose to 89% in the nine months ended September 30, 2026 (80% in the same period of 2025), offsetting lower grades. The dual-classification circuit of Dredge 10, commissioned in the third quarter, is expected to increase the reconciled recovery factor in approximately 8 points. The Company initiated the engineering phase of the suction production units namely SPU 2 and SPU 3.
The contract mining partners (CMP) program contributed 3,024 ounces in the quarter and 8,390 ounces in the nine months, at margins of 12% and 16% respectively, and currently comprises 13 units and three formalization sub-contracts; In the next quarter, is expected that the regional regulator approve the ten-year Stage 4 environmental licence (382.18 hectares) alongside as the Río Viejo permit in support of the formalization program. The Stage 3.1 environmental impact assessment, which would support the new production units and formalized operations, was filed with the National Environmental Licensing Authority (ANLA).
Exploration
Mineros’ exploration program was originally budgeted at $17.3 million, with 95,000 metres of planned drilling for 2026. The Company has since revised the program to a budget of $14.1 million and approximately 81,460 metres, as described below. The program is designed to support near-term production growth while advancing a pipeline of opportunities across the portfolio.
In Nicaragua, the Hemco Property drilling program has been reduced from 75,400 metres (originally budgeted at $11.0 million) to 67,860 metres (revised budget of $9.8 million). The revision reflects heavy rainfall in Nicaragua during the third quarter, which lasted longer than usual for the season and affected access, equipment mobilization and movement between drill platforms, particularly at the Pioneer Mine. The program remains predominantly focused on brownfield targets around existing operations and growth projects (including work at and near Porvenir), while selectively increasing greenfield exploration across the under-explored “Golden Triangle” district, an area defined by the historic mining towns of Bonanza, Rosita and Siuna, where the Company operates. The Golden Triangle is one of Central America’s most prolific mining regions, reported to have produced nine million ounces of gold, five million ounces of silver and 305 million pounds of copper.
In Colombia, Mineros continues to expect to complete 13,000 metres of drilling at the Nechí Property at a cost of $4.1 million, unchanged from the original plan.
In Chile, the original plan contemplated 7,000 metres of drilling at La Pepa for $2.2 million. The start of the campaign has been deferred due to severe weather and heavy winter snow accumulation, which restricted access to the high-altitude site. The revised 2026 program is 600 metres (budget of $0.2 million), with the balance of the campaign planned to continue through late June 2027, subject to seasonal conditions and safety requirements. The Company continues to de-risk the project and maintain strategic exposure to a high-potential exploration district.
Operational summary for the three and nine months ended September 30, 2026 and 2025.
The following table sets forth the gold produced by each of the operations of the Company for the three and nine months ended September 30, 2026, and 2025 with a discussion of the operational highlights for the same periods:
| Three Months Ended September 30, |
Variation | Nine Months Ended September 30, |
Variation | |||||||||
| 2026 | 2025 | ounces | % | 2026 | 2025 | ounces | % | |||||
| Nechí Property (Colombia) | 21,531 | 20,383 | 1,148 | 6 | % | 58,732 | 59,955 | (1,223 | ) | (2) % | ||
| CMP | 3,024 | 2,400 | 624 | 26 | % | 8,390 | 6,931 | 1,459 | 21 | % | ||
| Colombia | 24,555 | 22,783 | 1,772 | 8 | % | 67,122 | 66,886 | 236 | — | % | ||
| Hemco Property | 5,418 | 5,578 | (160 | ) | (3) % | 18,004 | 18,647 | (643 | ) | (3) % | ||
| BMP | 32,280 | 26,501 | 5,779 | 22 | % | 95,229 | 77,479 | 17,751 | 23 | % | ||
| Nicaragua | 37,698 | 32,079 | 5,619 | 18 | % | 113,234 | 96,126 | 17,107 | 18 | % | ||
| Total Gold Produced | 62,253 | 54,862 | 7,391 | 13 | % | 180,356 | 163,012 | 17,343 | 11 | % | ||
| Total Silver Produced | 176,576 | 100,159 | 76,417 | 76 | % | 523,796 | 248,151 | 275,646 | 111 | % | ||
Operational Summary for the three months ended September 30, 2026
- Gold production increased by 13% to 62,253 ounces of gold during the third quarter of 2026, compared with 54,862 ounces in the third quarter of 2025, driven by 18% higher production at the Hemco Property and 8% higher production at the Nechí Property, reflecting both higher gold output and strong silver recovery at the Hemco Property processing plant. At the Nechí Property in Colombia, third quarter production of 24,555 ounces reflects the variability characteristic of alluvial mining operations and is aligned with our planned operational sequence within our 2026 environmental, hydraulic, and mining plans.
- Cash Cost & AISC: Cash Cost per ounce of gold sold in the third quarter of 2026 was $1,974 and AISC per ounce of gold sold was $2,238, both tracking below the Company's 2026 guidance ranges of $2,070 – $2,170 per ounce for Cash Cost and $2,370 – $2,470 per ounce for AISC. Compared with the third quarter of 2025, Cash Cost per ounce increased by 16% (from $1,704) and AISC per ounce increased by 13% (from $1,982), reflecting higher payments to BMP and CMP driven by elevated gold prices and more gold purchased from each group, higher taxes & royalties, and a 25% US dollar devaluation versus the Colombian peso. Much of the above has been offset by more ounces of gold sold.
- Exploration and Evaluation Expenditures (“E&E”) for the three months ended September 30, 2026, E&E increased 24% as result of higher expenditures expenses of $1,097 offset by lower capitalized expenditures of $487 associated with reduced activities at the Porvenir Project.
| Three Months Ended September 30, |
Variation | Nine Months Ended September 30, |
Variation | |||||||||
| 2026 | 2025 | $ | % | 2026 | 2025 | $ | % | |||||
| E&E expenditures capitalized1 | 940 | 1,427 | (487 | ) | (34 | %) | 2,674 | 4,279 | (1,605 | ) | (38 | %) |
| E&E expenditures expensed2 | 2,212 | 1,114 | 1,097 | 98 | % | 5,780 | 3,205 | 2,575 | 80 | % | ||
| Total | 3,152 | 2,541 | 610 | 24 | % | 8,454 | 7,484 | 970 | 13 | % | ||
- Capitalized E&E expenditures are reflected in E&E projects in the consolidated statements of financial position.
- Expensed E&E expenditures are reported in the consolidated statement of profit or loss for the respective period under “Exploration expenses”
Operational Summary for the nine months ended September 30, 2026
- Gold production was up 11% during the nine months ended September 30, 2026 to 180,356 ounces of gold, compared with 163,012 ounces in the same period of 2025. The increase in gold production, relative to the comparable period in 2025, is a result of 18% greater production at the Hemco Property due to improved recoveries, higher grades and increased throughput, and an increase of a 0.4% in production at the Nechí Property due to higher gold recoveries.
- Cash Cost & AISC: Cash Cost per ounce of gold sold in the nine months ended September 30, 2026 was $2,059 and AISC per ounce of gold sold was $2,310, compared with Cash Cost per ounce of gold sold of $1,604 and AISC per ounce of gold sold of $1,869 for the same period in 2025. The 28% increase in Cash Cost per ounce of gold sold was due to 46% higher cost of sales, due to higher gold prices and more ounces purchased which result in higher costs to purchase ore from BMP in Nicaragua and CMP in Colombia, in addition to higher tax expenses, higher royalties due to the increase in the average price of gold per ounce, and an 18% US dollar devaluation in Colombia. The 24% increase in AISC per ounce of gold sold reflects higher Cash Cost per ounce of gold sold offset by a 1% decrease in sustaining capital expenditures.
- Exploration and Evaluation Expenditures for the nine months ended September 30, 2026, the Company incurred $8,454 in E&E expenditures, an increase of 13% compared with the same period of 2025. The increase for the nine months ended September 30, 2026, is due to higher exploration expenditures capitalized.
Health and Safety
Heading into the end of 2026, Mineros reaffirms its commitment to provide a safe and healthy workplace where employees and contractors conduct themselves in a responsible and safe manner. Additionally, the Company is committed to achieving high standards of occupational health and safety practices by evolving our management systems and rigorously monitoring performance targets. This commitment to excellence is validated by our ISO 45001 certifications at both the Nechí Property and Hemco Property.
The following table presents the safety statistics for the nine months ended September 30, 2026, and the same period 2025.
| Health and Safety KPIs | Nine Months Ended September 30, |
||
| 2026 | 2025(3) | ||
| Nechí Property | LTIFR(1) | 1.30 | 0.70 |
| (Colombia) | TRIFR(2) | 2.16 | 1.76 |
| Hemco Property | LTIFR | 0.25 | 0.04 |
| (Nicaragua) | TRIFR | 1.28 | 0.68 |
| Mineros | LTIFR | 0.67 | 0.32 |
| (Weighted Average) | TRIFR | 1.63 | 1.13 |
- Lost time injury frequency rate (“LTIFR”) refers to the number of lost time injuries per 200,000 hours worked during a reporting period.
- Total recordable incident frequency rate (“TRIFR”) refers to the total number of recordable work related injuries per 200,000 hours worked during the reporting period, including fatalities, lost time injuries, cases or alternate work and other injuries requiring treatment by a medical professional.
- The safety statistics for the nine months ended September 30, 2025, were revised to reflect reclassifications to accident categories which occurred as part of the year-end review.
Mineros’ weighted average LTIFR increased to 0.74 from 0.39 in the corresponding nine-month period of 2025, while the TRIFR increased to 1.66 from 1.28. The Company has reviewed the underlying events and is implementing corrective actions as part of its continuous safety improvement program. The Company remains committed to its zero-harm objective and to the ongoing evolution of its ISO 45001-certified occupational health and safety practices.
Mineros continues to strengthen its preventive safety management by targeting the behaviors that serve as leading indicators of accidents. Visible HSE leadership has intensified cross-inspections of critical tasks and proactive reporting of substandard acts and conditions across all operational areas. Together with stronger technical competency in occupational health and safety and rigorous critical risk management, these actions have been instrumental in advancing the safety culture.
Inorganic Growth and Exploration
The Company’s exploration and growth strategy is focused on the replacement and expansion of Mineral Resources and Mineral Reserves through exploration at or near its operating mines, the advancement of its growth projects and the evaluation of early-stage exploration targets across its underexplored property interests. The Company pursues these objectives through systematic exploration programs, including geological mapping and sampling, geochemical and geophysical surveys, drilling and technical studies.
A core component of the Company’s business strategy is to identify new mineralized zones and advance existing deposits towards development by increasing Mineral Resources and Mineral Reserves while progressively reducing geological and technical uncertainty. The Company’s growth portfolio includes the advancement of near-mine and district-scale opportunities at the Hemco Property, the preliminary economic evaluation of the La Pepa Project in Chile, and the ongoing integration and technical assessment of the Tolima Project. At the Nechí Property, the Company is also exploring a target located near the municipality of Caucasia, Antioquia, as part of its growth pipeline. These initiatives are intended to support the Company’s long-term pipeline of development opportunities while maximizing the value of its existing operating districts.
At the Hemco Property, the Company continues to review exploration targets to evaluate their near-term potential. The Porvenir Deposit, the Company’s most advanced growth project, remains the primary focus of technical and engineering work and project advancement. The Company continues to advance its assessment of the Luna Roja Deposit. An exploration plan was submitted to the relevant authorities outlining proposed field activities in 2026 and a potential drilling program in 2027, subject to the necessary permits and approvals.
Hemco Property, Nicaragua
Near Mine Exploration, Hemco Property Expansion
Near mine exploration is focused on the current mining operations, the Panama Mine and the Pioneer Mine. Mineralization is related to an epithermal gold system associated with multiple quartz veins.
During the third quarter of 2026, heavy rainfall in Nicaragua affected access, equipment mobilization and moves between drill platforms, particularly at the Pioneer Mine. The Company's proposed annual drilling program for the Hemco Property was reduced from 75,400 metres to 67,860 metres, a decrease of 7,540 metres, or 10%. The proposed reduction is allocated entirely to Pioneer, reducing its annual program from 26,000 metres to 18,460 metres. The Panama Mine program remains at 16,000 metres, bringing the proposed combined near-mine program to 34,460 metres.
During the third quarter of 2026, the Company completed 10,169 metres of near-mine exploration drilling, comprising 2,760 metres at the Panama Mine and 7,409 metres at the Pioneer Mine. Exploration drilling for the nine months ended September 30, 2026 totalled 22,305 metres, equivalent to approximately 65% of the proposed revised near-mine program of 34,460 metres. Drilling at Panama focused on Capitan, while drilling at Pioneer focused on La Reforma, Villavicencio, Pioneer 6, La Reforma FW, Pioneer and La Reforma Norte. The campaign is intended to support Mineral Resource and Mineral Reserve replacement and expansion at the two mines.
Brownfield Exploration, Hemco Property Expansion
Brownfield exploration is focused on the Bonanza block, which encompasses the concession areas located between the Panama Mine and the Pioneer Mine. The mineralization belongs to the same epithermal gold trend as the Panama and Pioneer mines, characterized by multiple quartz veins.
The annual brownfield exploration drilling program for the Hemco Property remains at approximately 15,700 metres under the proposed third-quarter 2026 forecast. The existing near-mine, brownfield and greenfield reporting classifications are retained.
During the third quarter of 2026, the Company completed 4,737 metres of brownfield exploration drilling at Xiloa and Xolotlan. Exploration drilling for the nine months ended September 30, 2026 totalled 12,254 metres, equivalent to approximately 78% of the annual program. This campaign forms part of the Company's ongoing resource replacement strategy for the Panama and Pioneer mines.
Porvenir Project
The Porvenir Project is a pre-development stage project located 10.5km southwest of the existing Hemco Property facilities. Mineralization consists of a volcanic hosted gold-zinc-silver deposit with epithermal quartz veins of intermediate sulphidation.
During the third quarter of 2026, the Company completed 4,795 metres across 25 holes at the Porvenir Project. Infill drilling accounted for 4,008 metres across 20 holes, bringing the infill program to 87% completion against the annual plan. Infill drilling targeted Porvenir Sur, Real McCoy, and Porvenir Norte, aimed at reducing geological uncertainty and de-risking the first three years of the mine plan. Condemnation drilling totaled 786 metres across 5 holes, advancing that program to 42.7% completion.
Guillermina Deposit
The Guillermina Deposit is an epithermal zinc-gold-silver deposit, located four kilometres west of the Pioneer deposit and three kilometres North of the Porvenir Project.
No exploration drilling was completed at the Guillermina Deposit during the nine months ended September 30, 2026. The second-quarter plan contemplated approximately 1,238 metres reallocated from Leticia for infill drilling of current Inferred Mineral Resources, with the objective of upgrading a portion of the resource to the Indicated Mineral Resource category. The Company expects to start the drilling program in the fourth quarter of 2026.
Leticia Deposit
The Leticia Deposit is an epithermal gold-silver-zinc deposit, located 500m northwest of the Porvenir Project.
The drilling campaign at the Leticia Deposit was concluded in the second quarter of 2026. No additional drilling was recorded during the third quarter, and exploration drilling for the nine months ended September 30, 2026 remained at 1,962 metres. The 1,238 metres remaining from the original 3,200-metre program has been reallocated to the Guillermina Deposit.
This drilling campaign was focused on infill drilling of current Inferred Mineral Resources, with the goal of upgrading a portion of the resource to the Indicated Mineral Resource category.
San Antonio Deposit
The San Antonio Deposit is an epithermal gold-silver-zinc deposit, located 700m southwest of the Porvenir Project.
No drilling is scheduled for San Antonio Deposit in 2026.
Luna Roja Deposit
The Luna Roja deposit is a skarn gold system located 24 km southeast of the existing Hemco facilities. The Company is focused on expanding current mineral resources and identifying new targets surrounding the main deposit.
The Company continues to advance its assessment of the Luna Roja Deposit. An exploration plan was submitted to the relevant authorities outlining proposed field activities in 2026 and a potential drilling program in 2027, subject to the necessary permits and approvals.
Hemco Property Regional Exploration
Mineros' regional green-field exploration is focused on three areas with early-stage targets: Bonanza, Rosita and Siuna districts. The Bonanza district excludes the designated brownfield area known as the Bonanza block, see Brownfield Exploration, Hemco Property Expansion.
The regional greenfield drilling program remains at 5,000 metres under the proposed third-quarter forecast, following the reduction from 22,000 metres disclosed in the second quarter to prioritize the expanded near-mine program. The 2026 regional drilling program is focused on targets within the Bonanza District, which hosts epithermal gold-silver-zinc mineralization identified through historical mining, artisanal workings and surface sampling.
Exploration drilling for the nine months ended September 30, 2026 totalled 3,142 metres, equivalent to approximately 63% of the annual program. The second-quarter drilling targeted Apoyo (formerly Experiencia) and Madrigal (formerly La Deseada).
The previously disclosed regional programs for the Rosita and Siuna districts contemplated geological mapping, prospecting, rock and soil geochemical sampling, and trenching where appropriate, to support the identification and prioritization of future drill targets. No drilling was recorded in these districts during the third quarter.
Nechí Property, Colombia
Near Mine Exploration, Nechí Property Expansion
At the Nechí Property, Mineros is exploring for alluvial gold predominantly east of the Nechí River, where the Company is currently mining within quaternary alluvial sediments.
The 2026 drilling plan remains unchanged and comprises 13,000 metres of drilling. Drilling commenced in April 2026. To support the annual program, a contractor-operated sonic drill rig began drilling on September 24, 2026, and the Company is evaluating a second rig to ensure the planned drilling program is completed during 2026.
During the third quarter of 2026, the Company completed 5,005 metres in 165 holes, bringing drilling for the nine months ended September 30, 2026 to 7,124 metres, approximately 55% of the annual drilling program. The third-quarter program comprised 4,926 metres of infill drilling in current production areas and 79 metres of reconnaissance drilling at the Río Cauca Target. Of the total, 4,941 metres in 162 holes were completed using sonic drilling and 64 metres in 3 holes using ward drilling.
La Pepa Property, Chile
The La Pepa Project is an advanced gold exploration project, 100% owned by Mineros, located in the Maricunga Gold Belt of the Atacama Region, Chile, approximately 800 km north of Santiago and 110 km east of Copiapó, at 4,200 metres above sea level in the Andes Mountains.
The commencement of the La Pepa exploration drilling campaign was deferred due to severe weather and heavy winter snow accumulation, which restricted access to the high-altitude site. Subject to weather conditions field operations are planned to commence through phased mobilization. The first drill rig is scheduled to begin operating during the first week of December 2026, followed by a second rig during the first week of January 2027. At a target drilling rate of 600 metres per rig per month, the Company expects to complete approximately 600 metres by December 31, 2026. The balance of the campaign is planned to continue through late June 2027, subject to seasonal operating conditions and safety requirements.
In June 2026, the Company obtained the sectoral permit required for the planned drilling program. The second-quarter disclosure also described ongoing environmental characterization studies and a NI 43-101 preliminary economic assessment which commenced in Q3 2026 and it is expected to be completed Q1 2027.
Tolima Property, Colombia
Tolima Project is a world-class gold porphyry exploration project, located in the Tolima Department of central Colombia, approximately 150 km west of Bogotá and 30 km west of Ibagué, at elevations ranging from 2,800 to 3,200 metres above sea level in the Central Cordillera of the Andes Mountains.
The company is preparing its first NI 43-101 compliant Mineral Resources Estimate by Q1 2027. The Company plans to continue surface exploration within the Tolima Project area in accordance with the Programa Único de Exploración y Explotación (PUEE). In parallel, the Company intends to advance an internal prefeasibility study, and progress environmental studies to support the Tolima Project’s evaluation and potential development.
The acquisition of Mineros Tolima provides for contingent consideration of up to $60,000, payable upon the approval of specified ore tonnage under the applicable work program and the granting of an environmental licence for the Tolima Project. The delimitation of the Los Nevados páramo under Resolution 1987 of 2016 remains subject to legal proceedings, the outcome of which may affect portions of the Tolima Project area. The historical estimate prepared by the previous owner has not been verified by the Company as a current Mineral Resource and should not be relied upon.
The Company is undergoing the studies to complete a NI 43-101 Mineral Resource Estimation for the deposit which is expected to be completed in Q1 2027.
CONFERENCE CALL AND WEBCAST DETAILS
As a reminder the Company will host a conference call tomorrow, Thursday, November 12, 2026, at 9:00 AM Colombian Standard Time (9:00 AM Eastern Standard Time).
Please register here to join us.
The live webcast requires previous registration, and interested parties are advised to access the webcast approximately ten minutes prior to the start of the call. The webcast will be archived on the Company’s website at www.mineros.com.co for up to a year following the call.
ABOUT MINEROS S.A.
Mineros is a leading Latin American gold mining company headquartered in Medellín, Colombia. The Company operates a diversified portfolio of assets in Colombia and Nicaragua and maintains a pipeline of development and exploration projects across the region, including the La Pepa Project in Chile and the Tolima Project near Cajamarca, Colombia.
With more than 50 years of operating history, Mineros maintains a longstanding focus on safety, sustainability, and disciplined capital allocation. Its common shares are listed on the Toronto Stock Exchange (MSA) and the Colombian Stock Exchange (MINEROS) and trade on the OTCQX® Best Market under the symbol MNSAF.
For further information, please contact:
Ann Wilkinson
Vice President, Investor Relations
+1 647-496-3011
Investor.relations@mineros.com.co
Juan Obando
Director, Investor Relations
+57 (4) 266-5757
relacion.inversionistas@mineros.com.co
QUALIFIED PERSON
Scientific and technical information contained in this news release has been reviewed and approved Maria Vallejo Garcia, P.Eng., FAusIMM, Vice President of Strategic Growth and Technical Services at Mineros S.A who is a qualified person within the meaning of National Instrument 43-101 – Standards of Disclosure for Mineral Projects (“NI 43-101”). The Scientific and technical information contained in this news release regarding the exploration programs and their execution has been reviewed and approved by Carlos Rios, P.GEO MAusIMM, Vice President of Exploration at Mineros S.A ho is a qualified person within the meaning of NI 43-101.
FORWARD-LOOKING STATEMENTS
This news release contains “forward looking information” within the meaning of applicable Canadian securities laws. Forward looking information includes statements that use forward looking terminology such as “may”, “could”, “would”, “will”, “should”, “intend”, “target”, “plan”, “expect”, “budget”, “estimate”, “forecast”, “schedule”, “anticipate”, “believe”, “continue”, “potential”, “view” or the negative or grammatical variation thereof or other variations thereof or comparable terminology. Such forward looking information includes, without limitation, statements with respect to the Company’s outlook for 2026; estimates for future mineral production and sales; the Company’s expectations, strategies and plans for the Material Properties; the Company’s planned exploration, development and production activities; statements regarding the projected exploration and development of the Company’s projects; adding or upgrading Mineral Resources and developing new mineral deposits; estimates of future capital and operating costs; the costs and timing of future exploration and development; estimates for future prices of gold and other minerals; expectations regarding the payment of dividends; and any other statement that may predict, forecast, indicate or imply future plans, intentions, levels of activity, results, performance or achievements.
Forward-looking information is based upon estimates and assumptions of management in light of management’s experience and perception of trends, current conditions and expected developments, as well as other factors that management believes to be relevant and reasonable in the circumstances, as of the date of this news release including, without limitation, assumptions about: favourable equity and debt capital markets; the ability to raise any necessary additional capital on reasonable terms to advance the production, development and exploration of the Company’s properties and assets; future prices of gold and other metal prices; the timing and results of exploration and drilling programs, and technical and economic studies; the development of the Porvenir Project; completion of its drilling programs; the accuracy of any Mineral Reserve and Mineral Resource estimates; the geology of the Material Properties being as described in the applicable technical reports; production costs; the accuracy of budgeted exploration and development costs and expenditures; the price of other commodities such as fuel; future currency exchange rates and interest rates; operating conditions being favourable such that the Company is able to operate in a safe, efficient and effective manner; political and regulatory stability; the receipt of governmental, regulatory and third party approvals, licenses and permits on favourable terms; obtaining required renewals for existing approvals, licenses and permits on favourable terms; requirements under applicable laws; sustained labour stability; stability in financial and capital goods markets; inflation rates; availability of labour and equipment; positive relations with local groups, including artisanal mining cooperatives in Nicaragua, and the Company’s ability to meet its obligations under its agreements with such groups; and satisfying the terms and conditions of the Company’s current loan arrangements. While the Company considers these assumptions to be reasonable, the assumptions are inherently subject to significant business, social, economic, political, regulatory, competitive and other risks and uncertainties, contingencies and other factors that could cause actual actions, events, conditions, results, performance or achievements to be materially different from those projected in the forward-looking information. Many assumptions are based on factors and events that are not within the control of the Company and there is no assurance they will prove to be correct.
For further information of these and other risk factors, please see the “Risk Factors” section of the Company’s annual information form dated March 31, 2026, available on SEDAR+ at www.sedarplus.com.
The Company cautions that the foregoing lists of important assumptions and factors are not exhaustive. Other events or circumstances could cause actual results to differ materially from those estimated or projected and expressed in, or implied by, the forward looking information contained herein. There can be no assurance that forward looking information will prove to be accurate, as actual results and future events could differ materially from those anticipated in such information. Accordingly, readers should not place undue reliance on forward looking information.
Forward looking information contained herein is made as of the date of this news release and the Company disclaims any obligation to update or revise any forward looking information, whether as a result of new information, future events or results or otherwise, except as and to the extent required by applicable securities laws.
NON-IFRS AND OTHER FINANCIAL MEASURES
The Company has included certain non-IFRS financial measures and non-IFRS ratios in this MD&A. Management believes that non-IFRS financial measures and non-IFRS ratios, when supplementing measures determined in accordance with IFRS, provide investors with an improved ability to evaluate the underlying performance of the Company. Non-IFRS financial measures and non-IFRS ratios do not have any standardized meaning prescribed under IFRS, and therefore may not be comparable to similar measures employed by other companies. This data is intended to provide additional information and should not be considered in isolation or as a substitute for measures of performance prepared in accordance with IFRS. For a discussion of the use of non-IFRS financial measures and reconciliations thereof to the most directly comparable IFRS measures, see below.
EBIT, EBITDA and Adjusted EBITDA
The Company believes that, in addition to conventional measures prepared in accordance with IFRS, certain investors use earnings before interest and tax (“EBIT”), earnings before interest, tax, depreciation and amortization (“EBITDA”), and adjusted earnings before interest, tax, depreciation and amortization (“Adjusted EBITDA”), which excludes certain non-operating income and expenses, such as financial income or expenses, hedging operations, forward contracts, exploration expenses, impairment of assets, foreign currency exchange differences, and other expenses (principally, donations, corporate projects and taxes incurred). The Company believes that Adjusted EBITDA provides useful information to investors and others in understanding and evaluating our operating results because it is consistent with the indicators management uses internally to measure the Company’s performance and is an indicator of the performance of the Company’s mining operations.
The following table sets out the calculation of EBIT, EBITDA and Adjusted EBITDA to Net Profit for the three and nine months ended September 30, 2026, and 2025:
| Three Months Ended September 30, |
Nine Months Ended September 30, |
|||||||
| 2026 | 2025 | 2026 | 2025 | |||||
| $ | $ | $ | $ | |||||
| Net Profit For The Period | 89,467 | 54,063 | 222,285 | 135,571 | ||||
| Less: Interest income | (1,127 | ) | (1,038 | ) | (2,301 | ) | (2,673 | ) |
| Add: Interest expense | 3,198 | 1,886 | 7,531 | 5,848 | ||||
| Add: Current tax1 | 41,596 | 21,019 | 118,174 | 61,075 | ||||
| Add/less: Deferred tax1 | (4,576 | ) | 670 | (13,655 | ) | (3,398 | ) | |
| EBIT | 128,559 | 76,599 | 332,035 | 196,422 | ||||
| Add: Depreciation and amortization | 12,518 | 14,054 | 46,907 | 40,078 | ||||
| EBITDA | 141,077 | 90,653 | 378,942 | 236,500 | ||||
| Less: Other income | (1,283 | ) | (2,141 | ) | (4,243 | ) | (3,129 | ) |
| Add: Share of results of associates | — | — | — | 59 | ||||
| Less: Finance income (excluding interest income) | (3 | ) | (1,676 | ) | (26 | ) | (1,687 | ) |
| Add: Finance expense (excluding interest expense) | 74 | 47 | 231 | 158 | ||||
| Add: Other expenses | 1,384 | 1,609 | 12,548 | 7,318 | ||||
| Add: Exploration expenses | 2,212 | 1,114 | 5,780 | 3,205 | ||||
| Add: Gold forward contract | (2,801 | ) | — | 10,507 | — | |||
| Less: Foreign exchange differences | (637 | ) | 670 | (1,745 | ) | 1,431 | ||
| Adjusted EBITDA2 | 140,022 | 90,276 | 401,995 | 243,854 | ||||
- For additional information regarding taxes, see note 14 of our unaudited consolidated financial statements for the three months ended September 30, 2026 and 2025.
- The reconciliation above does not include adjustments for (impairment) reversal of assets, because there would be a nil adjustment for the three and nine months ended September 30, 2026 and 2025.
Cash Cost
The objective of Cash Cost is to provide stakeholders with a key indicator that reflects as close as possible the direct cost of producing and selling an ounce of gold.
The Company reports Cash Cost per ounce of gold sold which is calculated by deducting revenue from silver sales, depreciation and amortization, environmental rehabilitation provisions and including cash used for retirement obligations and environmental and rehabilitation and sales of electric energy. This total is divided by the number of gold ounces sold. Cash Cost includes mining, milling, mine site security, royalties, and mine site administration costs, and excludes non-cash operating expenses. Cash Cost per ounce of gold sold is a non-IFRS financial measure used to monitor the performance of our gold mining operations and their ability to generate profit, and is consistent with the guidance methodology set out by the World Gold Council.
The following table provides a reconciliation of Cash Cost per ounce of gold sold on a by-product basis to cost of sales for the three and nine months ended September 30, 2026, and 2025.
| Three Months Ended September 30, |
Nine Months Ended September 30, |
|||||||||||
| 2026 | 2025 | 2026 | 2025 | |||||||||
| Cost of sales | $ | 145,082 | $ | 114,320 | $ | 464,045 | $ | 318,164 | ||||
| Less: Cost of sales of non-mining operations1 | (460 | ) | (312 | ) | (1,157 | ) | (879 | ) | ||||
| Less: Depreciation and amortization | (12,214 | ) | (13,745 | ) | (45,995 | ) | (39,242 | ) | ||||
| Less: Sales of silver | (13,917 | ) | (4,211 | ) | (37,222 | ) | (9,177 | ) | ||||
| Less: Sales of electric energy | (1,705 | ) | (1,627 | ) | (4,998 | ) | (4,551 | ) | ||||
| Less: Environmental rehabilitation provision | 2,745 | (1,423 | ) | 783 | (4,112 | ) | ||||||
| Less: Precious metal inventory write-down | (1,571 | ) | — | (11,853 | ) | — | ||||||
| Add: Use of environmental and rehabilitation liabilities | 1,128 | 464 | 2,602 | 1,219 | ||||||||
| Add: Use of retirement obligations | 1,882 | 16 | 1,971 | 107 | ||||||||
| Cash Cost | $ | 120,969 | $ | 93,482 | $ | 368,175 | $ | 261,529 | ||||
| Gold sold (oz) | 61,283 | 54,862 | 178,772 | 163,012 | ||||||||
| Cash Cost per ounce of gold sold ($) | $ | 1,974 | $ | 1,704 | $ | 2,059 | $ | 1,604 | ||||
- Refers to cost of sales incurred in the Company’s “Others” segment. See note 6 of our unaudited condensed interim consolidated financial statements for the three and nine months ended September 30, 2026 and 2025. The majority of this amount relates to the cost of sales of latex.
All-in Sustaining Costs
The objective of AISC is to provide stakeholders with a key indicator that reflects as closely as possible the full cost of producing and selling an ounce of gold. AISC per ounce of gold sold is a non-IFRS ratio that is intended to provide investors with transparency regarding the total costs of producing one ounce of gold in the relevant period.
The Company reports AISC per ounce of gold sold on a by-product basis. The methodology for calculating AISC per ounce of gold sold is set out below and is consistent with the guidance methodology set out by the World Gold Council. The World Gold Council definition of AISC seeks to extend the definition of total Cash Cost by deducting cost of sales of non-mining operations and adding administrative expenses, sustaining exploration, sustaining leases and leaseback and sustaining capital expenditures. Non-sustaining costs are primarily those related to new operations and major projects at existing operations that are expected to materially benefit the current operation. The determination of the sustaining versus non-sustaining classification requires judgment by management. AISC excludes current and deferred income tax payments, finance expenses and other expenses. Consequently, these measures are not representative of all the Company’s cash expenditures. In addition, the calculation of AISC does not include depreciation and amortization cost or expense as it does not reflect the impact of expenditures incurred in prior periods. Therefore, it is not indicative of the Company’s overall profitability. Other companies may quantify these measures differently because of different underlying principles and policies applied. Differences may also occur due to different definitions of sustaining versus non-sustaining.
The following table provides a reconciliation of AISC per ounce of gold sold to cost of sales for the three and nine months ended September 30, 2026, and 2025.
| Three Months Ended September 30, |
Nine Months Ended September 30, |
|||||||||||
| 2026 | 2025 | 2026 | 2025 | |||||||||
| Cost of sales | $ | 145,082 | $ | 114,320 | $ | 464,045 | $ | 318,164 | ||||
| Less: Cost of sales of non-mining operations1 | (460 | ) | (312 | ) | (1,157 | ) | (879 | ) | ||||
| Less: Depreciation and amortization | (12,214 | ) | (13,745 | ) | (45,995 | ) | (39,242 | ) | ||||
| Less: Sales of silver | (13,917 | ) | (4,211 | ) | (37,222 | ) | (9,177 | ) | ||||
| Less: Sales of electric energy | (1,705 | ) | (1,627 | ) | (4,998 | ) | (4,551 | ) | ||||
| Less: Environmental rehabilitation provision | 2,745 | (1,423 | ) | 783 | (4,112 | ) | ||||||
| Less: Precious metal inventory write-down | (1,571 | ) | — | (11,853 | ) | — | ||||||
| Add: Use of environmental and rehabilitation liabilities | 1,128 | 464 | 2,602 | 1,219 | ||||||||
| Add: Use of Retirement obligations | 1,882 | 16 | 1,971 | 107 | ||||||||
| Add: Administrative expenses | 6,633 | 5,436 | 18,874 | 17,001 | ||||||||
| Less: Depreciation and amortization of administrative expenses2 | (304 | ) | (309 | ) | (912 | ) | (836 | ) | ||||
| Add: Sustaining leases and leaseback3 | 2,920 | 2,928 | 9,232 | 8,547 | ||||||||
| Add: Sustaining exploration4 | — | 201 | — | 427 | ||||||||
| Add: Sustaining capital expenditures5 | 6,918 | 7,023 | 17,637 | 18,055 | ||||||||
| AISC from operations | $ | 137,136 | $ | 108,761 | $ | 413,006 | $ | 304,723 | ||||
| Gold sold (oz) | 61,283 | 54,862 | 178,772 | 163,012 | ||||||||
| AISC per ounce of gold sold ($) | 2,238 | 1,982 | 2,310 | 1,869 | ||||||||
- Cost of sales of non-mining operations is the cost of sales excluding cost incurred by non-mining operations and the majority of this cost comprises cost of sales of latex.
- Depreciation and amortization of administrative expenses is included in the administrative expenses line on the unaudited consolidated financial statements and is mainly related to depreciation for corporate office spaces and local administrative buildings at the Hemco Property.
- Represents most lease payments as reported in the unaudited consolidated financial statements of cash flows and is made up of the principal of such cash payments, less non-sustaining lease payments. Lease payments for new development projects and capacity projects are classified as non-sustaining.
- Sustaining exploration: Exploration expenses and exploration and evaluation projects as reported in the unaudited consolidated interim financial statements, less non-sustaining exploration. Exploration expenditures are classified as either sustaining or non-sustaining based on a determination of the type and location of the exploration expenditure. Exploration expenditures within the footprint of operating mines are considered costs required to sustain current operations and so are included in sustaining costs. Exploration expenditures focused on new ore bodies near existing mines (i.e. brownfield), new exploration projects (i.e. greenfield) or other generative exploration activity not linked to existing mining operations are classified as non-sustaining.
- Sustaining capital expenditures: Represents the capital expenditures at existing operations including, periodic capitalized stripping and underground mine development costs, ongoing replacement of mine equipment and overhaul of existing equipment, and is calculated as total additions to property, plant and equipment (as reported on the consolidated statements of cash flows), less non-sustaining capital. Non-sustaining capital represents capital expenditures for major projects, including projects at existing operations that are expected to materially benefit the operation and provide a level of growth, as well as enhancement capital for significant infrastructure improvements at existing operations. Non-sustaining capital expenditures during the three months and year ended September 30, 2026, are primarily related to major projects at the Hemco Property and the Nechí Property. The sum of sustaining capital expenditures and non-sustaining capital expenditures is reported as the total of additions of property plant and equipment in the .unaudited condensed interim consolidated financial statements.
Cash Cost and All-in Sustaining Costs by Operating Segment
The following table provides a reconciliation of Cash Cost per ounce of gold sold and AISC per ounce of gold sold by operating segment2 to cost of sales, for the three and nine months ended September 30, 2026, and 2025.
| Three months ended September 30, 2026 |
Three months ended September 30, 2025 |
||||
| Nechí Property | Own Operation | Own Operation | |||
| Cost of sales | 42,369 | 35,888 | |||
| Less: Depreciation and amortization | (4,530 | ) | (4,742 | ) | |
| Less: Sales of silver | (32.63 | ) | (75.13 | ) | |
| Less: Sales of electric energy | (1,705 | ) | (1,627 | ) | |
| Less: Intercompany royalty | (6,844 | ) | (5,635 | ) | |
| Less: Environmental rehabilitation provision | 2,745 | (1,423 | ) | ||
| Add: Use of environmental and rehabilitation liabilities | 1,128 | 464 | |||
| Cash Cost | 33,131 | 22,850 | |||
| AISC Adjustments | |||||
| Less: Depreciation and amortization of administrative expenses | (3 | ) | (3 | ) | |
| Add: Administrative expenses | 1,606 | 2,150 | |||
| Add: Sustaining leases and leaseback | 1,124 | 747 | |||
| Add: Sustaining exploration | — | 201 | |||
| Add: Sustaining capital expenditure | 4,343 | 2,914 | |||
| AISC | 40,201 | 28,859 | |||
| Gold sold (oz) | 19,946 | 20,383 | |||
| Cash Cost per ounce of gold sold ($) | 1,661 | 1,121 | |||
| AISC per ounce of gold sold ($) | 2,015 | 1,416 | |||
| Three months ended September 30, 2026 |
Three months ended September 30, 2025 |
||||
| Hemco Property | Underground operation | Underground operation | |||
| Cost of sales | 9,899 | 13,890.96 | |||
| Less: Depreciation and amortization | (4,412 | ) | (5,114 | ) | |
| Less: Sales of silver | (1,838 | ) | (684 | ) | |
| Add: Use of Retirement obligations | 338.93 | 5 | |||
| Cash Cost | 3,988 | 8,098 | |||
| AISC Adjustments | |||||
| Less: Depreciation and amortization of administrative expenses | (5.56 | ) | (10.27 | ) | |
| Add: Administrative expenses | 361.48 | 625.76 | |||
| Add: Sustaining leases and Leaseback | 1,778 | 2,035 | |||
| Add: Sustaining capital expenditure | 148 | 2,169 | |||
| AISC | 6,270 | 12,918 | |||
| Gold sold (oz) | 5,418 | 5,578 | |||
| Cash Cost per ounce of gold sold ($) | 736 | 1,452 | |||
| AISC per ounce of gold sold ($) | 1,157 | 2,316 | |||
| Nine months ended September 30, 2026 |
Nine months ended September 30, 2025 |
||||
| Nechí Property | Own Operation | Own Operation | |||
| Cost of sales | 123,164 | 100,133 | |||
| Less: Depreciation and amortization | (14,627 | ) | (13,471 | ) | |
| Less: Sales of silver | (292.78 | ) | (194.45 | ) | |
| Less: Sales of electric energy | (4,998 | ) | (4,551 | ) | |
| Less: Intercompany royalty | (20,695 | ) | (15,375 | ) | |
| Less: Environmental rehabilitation provision | 783 | (4,112 | ) | ||
| Add: Use of environmental and rehabilitation liabilities | 2,602 | 1,219 | |||
| Cash Cost | 85,937 | 63,648 | |||
| AISC Adjustments | |||||
| Less: Depreciation and amortization of administrative expenses | (9 | ) | (10 | ) | |
| Add: Administrative expenses | 3,981 | 3,963 | |||
| Add: Sustaining leases and Leaseback | 2,973 | 2,177 | |||
| Add: Sustaining exploration | — | 427 | |||
| Add: Sustaining capital expenditure | 9,677 | 7,856 | |||
| AISC | 102,559 | 78,061 | |||
| Gold sold (oz) | 57,148 | 59,954.58 | |||
| Cash Cost per ounce of gold sold ($) | 1,504 | 1,062 | |||
| AISC per ounce of gold sold ($) | 1,795 | 1,302 | |||
| Nine months ended September 30, 2026 |
Nine months ended September 30, 2025 |
||||
| Hemco Property | Underground operation | Underground operation | |||
| Cost of sales | 43,928 | 44,193 | |||
| Less: Depreciation and amortization | (18,148 | ) | (14,393 | ) | |
| Less: Sales of silver | (6,959 | ) | (1,634 | ) | |
| Add: Use of Retirement obligations | 353 | 40 | |||
| Cash Cost | 19,174 | 28,205 | |||
| AISC Adjustments | |||||
| Less: Depreciation and amortization of administrative expenses | (22 | ) | (30.12 | ) | |
| Add: Administrative expenses | 1,538 | 1,490 | |||
| Add: Sustaining leases and Leaseback | 6,196 | 5,945 | |||
| Add: Sustaining exploration | — | — | |||
| Add: Sustaining capital expenditure | 2,511 | 5,262 | |||
| AISC | 29,397 | 40,871 | |||
| Gold sold (oz) | 18,004 | 18,647.37 | |||
| Cash Cost per ounce of gold sold ($) | 1,065 | 1,513 | |||
| AISC per ounce of gold sold ($) | 1,633 | 2,192 | |||
Margin CMP & BMP
The margin between the All-In Sustaining Cost (AISC) of each operation and the average price of gold sold is a key indicator of operational profitability and financial health for a gold mining company. AISC represents the comprehensive cost to produce one ounce of gold, including direct mining costs, sustaining capital expenditures, corporate overhead, and other ongoing expenses necessary to maintain current production levels. By comparing the AISC of each operation to the average realized gold price during the reporting period, we can assess the profitability of each mine and the company as a whole.
| CMP | Three Months Ended September 30, |
Nine Months Ended September 30, |
||||||
| 2026 | 2025 | 2026 | 2025 | |||||
| Average realized price per ounce of gold sold ($) | 4,301 | 3,464 | 4,451 | 3,220 | ||||
| AISC ($/oz) | 3,775 | 2,907 | 3,737 | 2,945 | ||||
| Margin ($/oz) | 526 | 557 | 714 | 275 | ||||
| Margin | 12 | % | 16 | % | 16 | % | 9 | % |
| BMP | Three Months Ended September 30, |
Nine Months Ended September 30, |
||||||
| 2026 | 2025 | 2026 | 2025 | |||||
| Average realized price per ounce of gold sold ($) | 4,301 | 3,464 | 4,451 | 3,220 | ||||
| AISC ($/oz) | 2,351 | 2,239 | 2,554 | 2,050 | ||||
| Margin ($/oz) | 1,950 | 1,225 | 1,897 | 1,170 | ||||
| Margin | 45 | % | 35 | % | 43 | % | 36 | % |
Gold equivalent (“AuEq”)(oz)
The Company calculates gold equivalent ounces to provide a measure that reflects the aggregate economic potential of the assets in question. The methodology employed for the calculation of equivalent ounces is as follows: Gold ounces produced and revenue derived from silver ounces sold is divided by the average realized price per ounce of gold sold. This approach captures the value contributed by both gold and silver production, thereby enabling a comprehensive evaluation of the asset’s overall economic viability.
The following table provides a reconciliation of Gold equivalent by operating segment3 to cost of sales, for the three and nine months ended September 30, 2026, and 2025.
| Three months ended September 30, |
Nine months ended September 30, |
|||
| AuEq Ounces Total | 2026 | 2025 | 2026 | 2025 |
| Gold sold (oz) | 61,283 | 54,862 | 178,772 | 163,012 |
| Silver sales ($) | 13,917 | 4,211 | 37,222 | 9,177 |
| Average realized price per ounce of gold sold ($) | 4,301 | 3,464 | 4,451 | 3,220 |
| AuEq Ounces Total | 64,499 | 56,078 | 187,135 | 165,862 |
| Three months ended September 30, |
Nine months ended September 30, |
|||
| AuEq Ounces Nechí Property | 2026 | 2025 | 2026 | 2025 |
| Gold sold (oz) | 22,970 | 22,783 | 65,537 | 66,886 |
| Silver sales ($) | 37 | 84 | 334 | 217 |
| Average realized price per ounce of gold sold ($) | 4,301 | 3,464 | 4,451 | 3,220 |
| AuEq Ounces Nechí Property | 22,979 | 22,807 | 65,612 | 66,953 |
| Three months ended September 30, |
Nine months ended September 30, |
|||
| AuEq Ounces Hemco Property | 2026 | 2025 | 2026 | 2025 |
| Gold sold (oz) | 37,698 | 32,079 | 113,234 | 96,126 |
| Silver sales ($) | 11,747 | 4,127 | 37,489 | 8,960 |
| Average realized price per ounce of gold sold ($) | 4,301 | 3,464 | 4,451 | 3,220 |
| AuEq Ounces Hemco Property | 40,429 | 33,270 | 121,655 | 98,909 |
Net Free Cash Flow
The Company uses the financial measure “net free cash flow” and “operating cash flow before strategic gold purchases”, which are non-IFRS financial measures, to supplement information regarding cash flows generated by operating activities. The Company believes that in addition to IFRS financial measures, certain investors and analysts use this information to evaluate the Company’s performance with respect to its operating cash flow capacity to meet recurring outflows of cash.
Net Free Cash Flow is calculated from cash flows from operating activities (IAS 7 mandatory), adding the net effect of precious metals purchases and sales for the period to arrive at operating cash flow before operating strategic gold purchases, and deducting recurring non-discretionary expenditures: sustaining capital expenditures, interest paid, and dividends paid. This metric reflects the free cash generated by mining operations after mandatory commitments, without distortion from precious metal treasury decisions.
The following table sets out the calculation of the Company’s net free cash flow to net cash flows generated by operating activities for the three and nine months ended September 30, 2026, and 2025:
| Three Months Ended September 30, |
Nine Months Ended September 30, |
|||||||||||
| 2026 | 2025 | 2026 | 2025 | |||||||||
| $ | $ | $ | $ | |||||||||
| Net cash flows generated by operating activities | $ | (21,638 | ) | $ | 77,316 | $ | (52,396 | ) | $ | 148,770 | ||
| Add: Net purchases of precious metals | 137,301 | — | 247,309 | — | ||||||||
| Operating cash flows before strategic gold purchases | 115,663 | 77,316 | 194,913 | 148,770 | ||||||||
| Non-discretionary items: | ||||||||||||
| Less: Sustaining capital expenditures | (6,918 | ) | (7,023 | ) | (17,637 | ) | (18,055 | ) | ||||
| Less: Interest paid | (420 | ) | (432 | ) | (1,162 | ) | (1,864 | ) | ||||
| Less: Dividends paid | (7,262 | ) | (7,461 | ) | (22,007 | ) | (22,410 | ) | ||||
| Net free cash flow(1) | $ | 101,063 | $ | 62,400 | $ | 154,107 | $ | 106,441 | ||||
Return on Capital Employed (“ROCE”)
The Company uses ROCE as a measure of long-term operating performance to measure how effectively management utilizes the capital it is provided. This non-IFRS ratio is intended to provide additional information and should not be considered in isolation or as a substitute for measures of performance prepared in accordance with IFRS. The calculation of ROCE, expressed as a percentage, is Adjusted EBIT (calculated in the manner set out in the table below) divided by the average of the opening and closing capital employed for the 12 months preceding the period end. Capital employed for a period is calculated as total assets at the beginning of that period, less total current liabilities.
| Twelve Months Ended September 30 |
||||||
| 2026 | 2025 | |||||
| Adjusted EBITDA (last 12 months) | $ | 516,545 | $ | 300,749 | ||
| Less: Depreciation and amortization (last 12 months) | (62,925 | ) | (51,710 | ) | ||
| Adjusted EBIT (A) | $ | 453,620 | $ | 249,039 | ||
| — | — | |||||
| Total assets at the beginning of the period | $ | 751,017 | $ | 582,036 | ||
| Less: Total current liabilities at the beginning of the period | (156,829 | ) | (106,022 | ) | ||
| Opening Capital Employed (B) | $ | 594,188 | $ | 476,014 | ||
| Total assets at the end of the period | $ | 1,166,673 | $ | 737,203 | ||
| Less: Current liabilities at the end of the period | (388,131 | ) | (162,368 | ) | ||
| Closing Capital employed (C) | $ | 778,542 | $ | 574,835 | ||
| Average Capital employed (D)= (B) + (C) /2 | $ | 686,365 | $ | 525,425 | ||
| ROCE (A/D) | 66 | % | 47 | % | ||
Net Cash
Net Cash is a non-IFRS financial measure that provides insight regarding the liquidity position of the Company. Net cash shown below is calculated as cash, cash equivalents plus precious metals less nominal undiscounted debt including leases, recognizing that gold in treasury is an asset that effectively reduces the Company's net indebtedness to the same extent as cash. The following sets out the calculation of Net Cash as at September 30, 2026 and 2025.
| September 30, | ||||||
| 2026 | 2025 | |||||
| Cash and cash equivalents | $ | 54,032 | $ | 102,219 | ||
| Plus: Bullion | 145,381 | — | ||||
| Less: Loans and other borrowings | $ | (127,735 | ) | $ | (17,637 | ) |
| Net cash | 71,678 | 84,582 | ||||
Average Realized Price
The Company uses “average realized price per ounce of gold sold” and “average realized price per ounce of silver sold”, which are non-IFRS financial measures. Average realized metal price represents the revenue from the sale of the underlying metal as per the statement of operations, adjusted to reflect the effect of trading at the holding company level (parent company) on the sales of gold purchased from subsidiaries. Average realized prices are calculated as the revenue related to gold and silver sales divided by the number of ounces of gold sold. The following table sets out the reconciliation of average realized metal prices to sales of gold and sales of silver for the three and nine months ended September 30, 2026 and 2025:
| Three Months Ended September 30, |
Nine Months Ended September 30, |
|||
| 2026 | 2025 | 2026 | 2025 | |
| Sales of gold ($) | 263,595 | 190,051 | 795,784 | 524,896 |
| Gold sold (oz) | 61,283 | 54,862 | 178,772 | 163,012 |
| Average realized price per ounce of gold sold ($) | 4,301 | 3,464 | 4,451 | 3,220 |
| Sales of silver ($) | 13,917 | 4,211 | 37,222 | 9,177 |
| Silver sold (oz) | 211,308 | 100,159 | 523,754 | 248,151 |
| Average realized price per ounce of silver sold ($) | 66 | 42 | 71 | 37 |
___________________________
1 The preliminary doré production figure reported for the nine months ended September 30, 2026 was 181,466 ounces. Following the final smelting, assaying and commercial refining process carried out by the specialized refiner in Switzerland, the final volume of fine gold refined and sold was determined to be 180,356 ounces.
The variation between the preliminary doré production figure and the commercial settlement primarily reflects final weighing and assaying adjustments, together with technical losses inherent in the refining process. In accordance with our accounting policies, all of the metal refined was sold during the period, and 100% of the related revenue was recognized in the financial statements.
2 For additional information regarding segments (Material Properties), see note 6 of our unaudited condensed interim consolidated financial statements for the three and nine months ended September 30, 2026 and 2025.
3 For additional information regarding segments (Material Properties), see note 6 of our unaudited condensed interim consolidated financial statements for the three and nine months ended September 30, 2026 and 2025.

Featured Image: Megapixl @ Abutyrin